

Michael Segaline Data Scientist and Media LION
be Relevant.
April 24, 2026
Abstract:
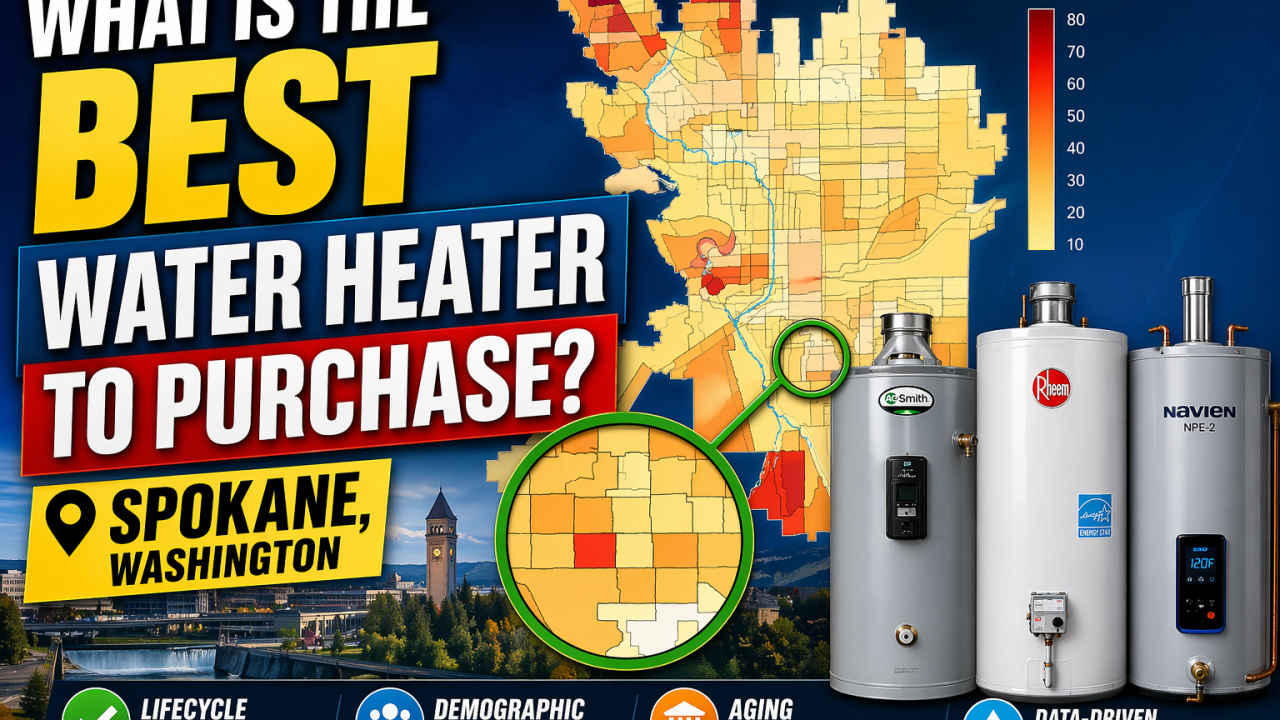
This study analyzes 20,018 residential water heater permits issued by the City of Spokane, Washington between January 2005 and January 2025. Permit data was merged with Spokane County voter registration records and voting precinct shapefiles to produce demographic and geospatial analyses. Spokane residential new-build permit data was appended to distinguish high-frequency permit precincts driven by new construction from those reflecting aging infrastructure replacement cycles.
Three non-parametric statistical tests — Kruskal-Wallis, Mann-Whitney U, and Shapiro-Wilk — were applied to same-type water heater replacement cycle pairs. Both the Kruskal-Wallis and Mann-Whitney U tests returned a p-value of 0.24, failing to reject the null hypothesis and indicating no statistically significant difference between gas and electric replacement cycle distributions. The Shapiro-Wilk test produced a statistic of 0.958, rejecting normality while revealing a near-parametric gas replacement distribution consistent with lean six-sigma manufacturing expectations.
Key findings include: gas water heaters are more than twice as prevalent as electric; the most common permit filer age is 36; water heater type preference is not age-dependent; approximately 25% of addresses switch from electric to gas upon replacement; and the City of Spokane generates approximately $12,750 annually in water heater permit fees. A precinct-level Aging Infrastructure Map was produced, representing a novel demand response targeting tool with direct applications for utility load forecasting and electric grid planning.
Research Questions:
1. Is there a statistical difference in the lifespans of Gas vs. Electric water heaters?
2. What is the rate that people switch between water heater types?
3. What water heater type is the most common?
4. What is the most common age of a person that applies for a water heater permit?
5. Does water heater type depend on the permit filer’s age?
6. How much annual revenue does the City of Spokane make in selling water heater permits?
7. Does the distribution of water heater life cycles fall on a bell-curve?
8. What current Spokane subdivision(s) are currently experiencing a high amount of water heater permits filed?
9. How many of those high frequency locations are not associated with residential new-build activity?
10. Can we create and Aging Infrastructure Map for water heater replacement prediction waves and demand response targeting for the City of Spokane?
Research Objectives:
Combine the Spokane Water Heater Permit data with Spokane County Voter Data into a master dataset.
Combine the Spokane County Voting Precinct shape file to the master set.
Combine the Spokane Residential New Build permit dataset to the master set.
Map the Spokane voting precincts according to all water heater frequencies.
Map the Spokane voting precincts according to electric water heater frequencies.
Map the Spokane water heaters frequencies with residential newbuild frequencies.
Kruskal-Wallis Test
Null Hypothesis H₀: There is no statistically significant difference between the distributions of water heater replacement cycle lengths across the gas and electric populations.
Alternative Hypothesis H₁: At least one of the populations differs significantly in replacement cycle length from the others.
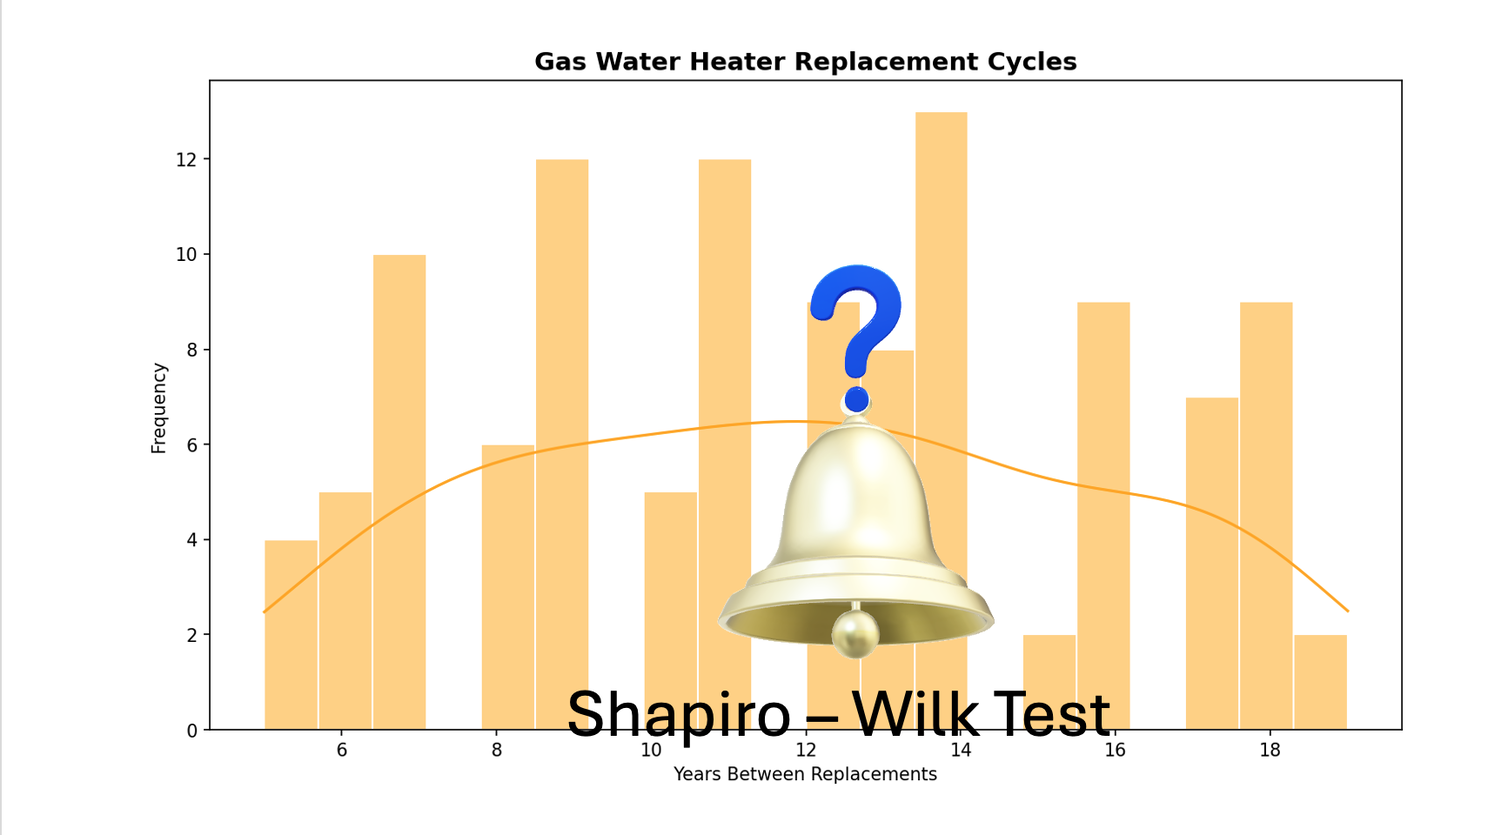
Shapiro-Wilk Test
Null Hypothesis H₀: The distribution of replacement cycle lengths for gas water heaters does not significantly deviate from a normal distribution.
Alternative Hypothesis H₁: The distribution of replacement cycle lengths for gas water heaters significantly deviates from a normal distribution.
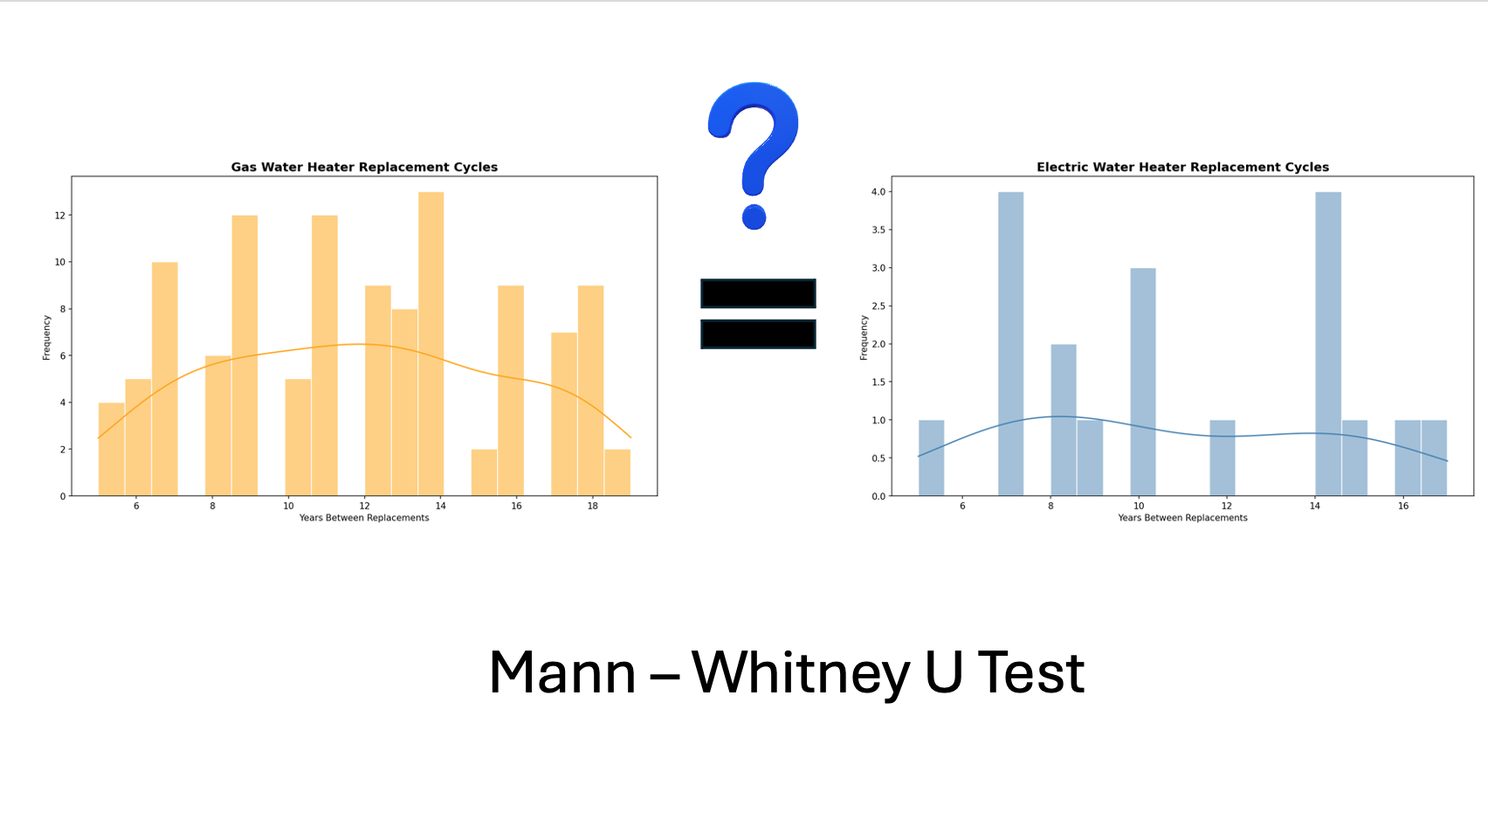
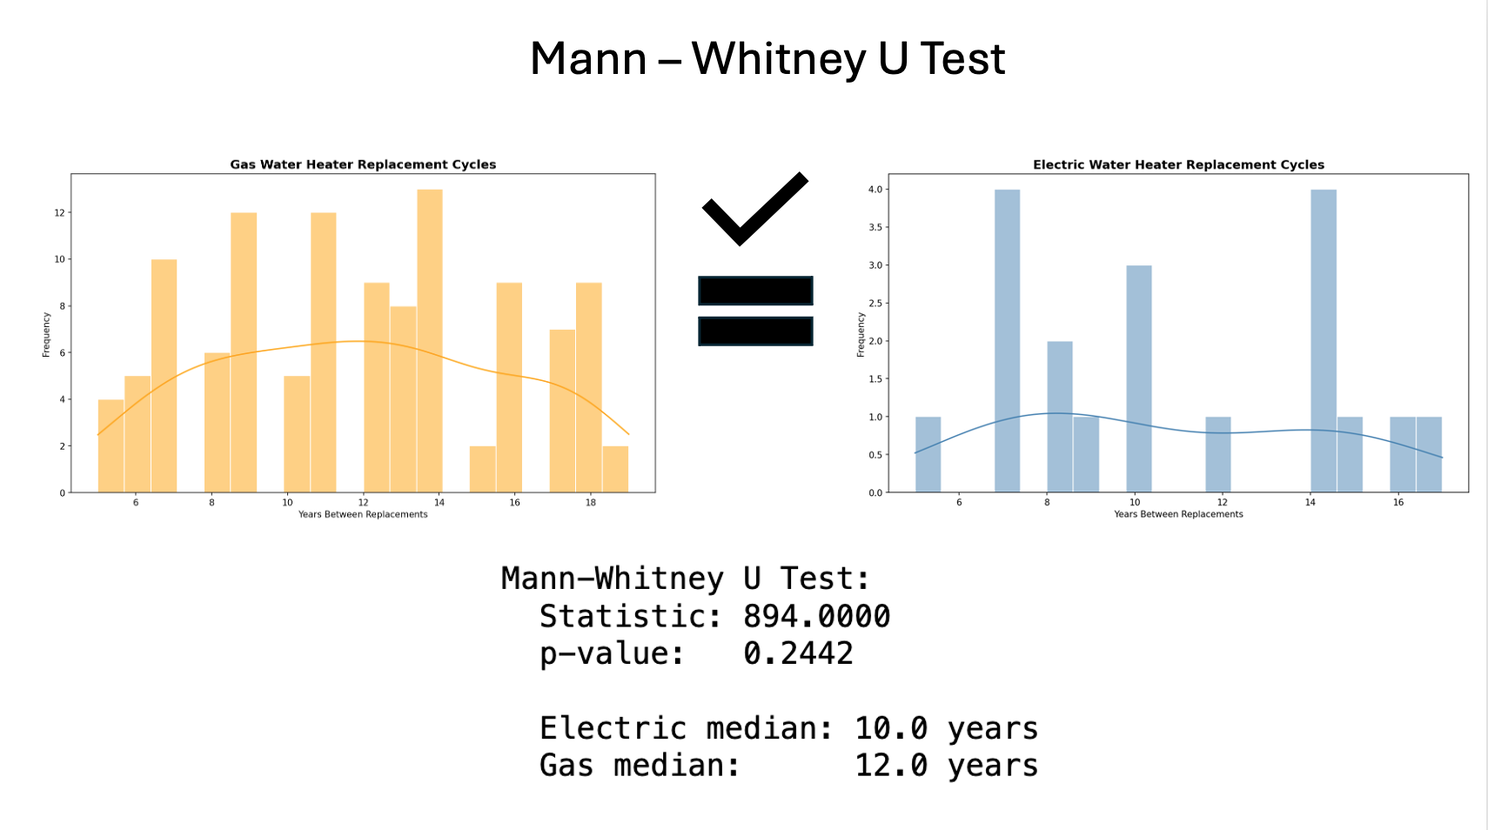
Mann-Whitney U Test
Null Hypothesis H₀: There is no statistically significant difference between the median replacement cycle lengths of gas water heaters and electric water heaters.
Alternative Hypothesis H₁: The median replacement cycle length of gas water heaters is statistically significantly different from the median replacement cycle length of electric water heaters.
Context:
The contribution of this study to the field of data science, consumer knowledge, electric grid planning, and political intelligence; Investigating differences between gas and electric water heater lifecycles with statistical tests. With this information a homeowner can make a better decision as to what type of water heater to purchase. Local industries and utility providers could improve service delivery, outreach efficiency, and consumer education by identifying geographic and demographic segments most likely to benefit from targeted information campaigns.
An article titled, Using statistical tests to compare the coefficient of performance of air source heat pump water heaters, showcases a study using Kruskal-Wallis testing to explore working strength using the identical variables of ‘Heater Type’, ‘time’, and ‘Frequency’ (Kusakana, 2022). They found that these variables are key factors in overall content engagement and brand awareness. Another article titled: Qualitative Methodology for comparison of Performance of Air Source Heat Pump Water Heaters, uses Kruskal-Wallis testing to investigate water heater execution involving similar variables of “Date”, “Heater Type”, and “Frequency” (Tangwae, 2020).
The Kruskal-Wallis H-test, tests the null hypothesis that the population median of all of the groups are equal. It is a non-parametric version of ANOVA (Scipy, 2020). Understanding these variables can help describe the relationship between the Independent Variables and Dependent Variables.
The Shapiro-Wilk test is necessary to determine the if the frequency between water heater replacement types is normally distributed; Testing for conformity to the lean-six-sigma factory curve.
According to the article, Normality Tests, “The Shapiro-Wilk test whether the outcome data, a random sample from the entire population, came from a normally distributed population. In other words, the Shapiro-Wilk test evaluates how likely it is that the values in the sample are observed, if the outcome variable is normally distributed in the entire population” (Yang, 2021).
For good measure, the Mann-Whitney U test will be used to investigate distribution differences. Mann-Whitney U test is used variables with non-parametric distributions (Emerson, 2023).
Data:
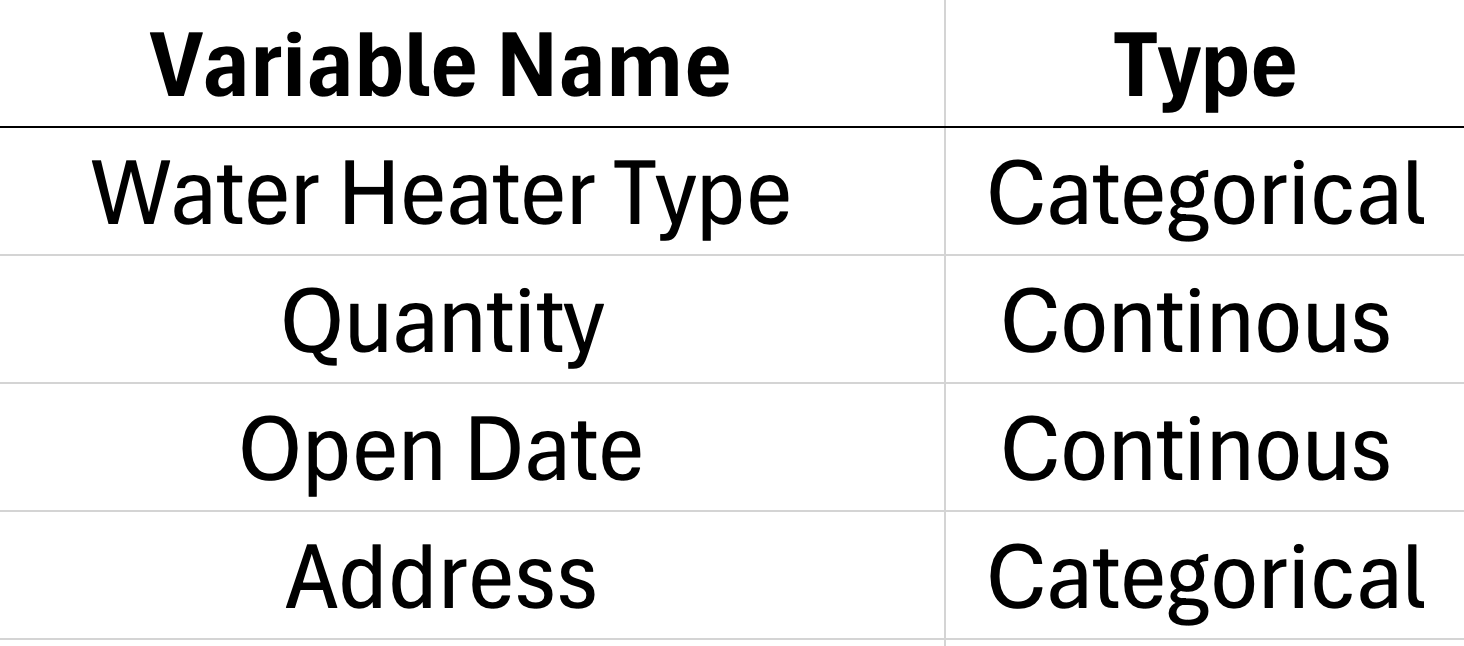
The dataset of Spokane Washington water heater permits containing the necessary variables was sourced from the City of Spokane, WA via records requests. The dataset contains almost 20,018 rows (before any rows where removed) and 7 columns. ‘Record ID’, ‘Water Heater Type’, ‘Quantity’, ‘Open Date’, ‘Address’, ‘City’, ‘State’. The additional columns of ‘open_year’, ‘open_month’, and ‘open_day’ where engineered from ‘Open Date’. When received the dataset was 0% sparse and contained 0 duplicate instances.
The dataset is limited to only 20 years of filed water heater permits; Starting with instances from 1/3/2005 to 1/1/2025. The dataset has multiple columns for possible exploration. The columns: ‘Record ID’, ‘City’, and ‘State’ will be dropped from the analysis, due to redundancy.
Below is a list of variables of focus for the water heater permits:
The data governance for the City of Spokane residential newbuilds was also sourced from the same portal link. A more details on the Spokane residential newbuilds dataset can be found here: https://spokaneai.io/2025/07/22/is-spokane-washington-a-fast-growing-city/
Available to the public via the City of Spokane, meaning that the datasets are the living testimony of the city.
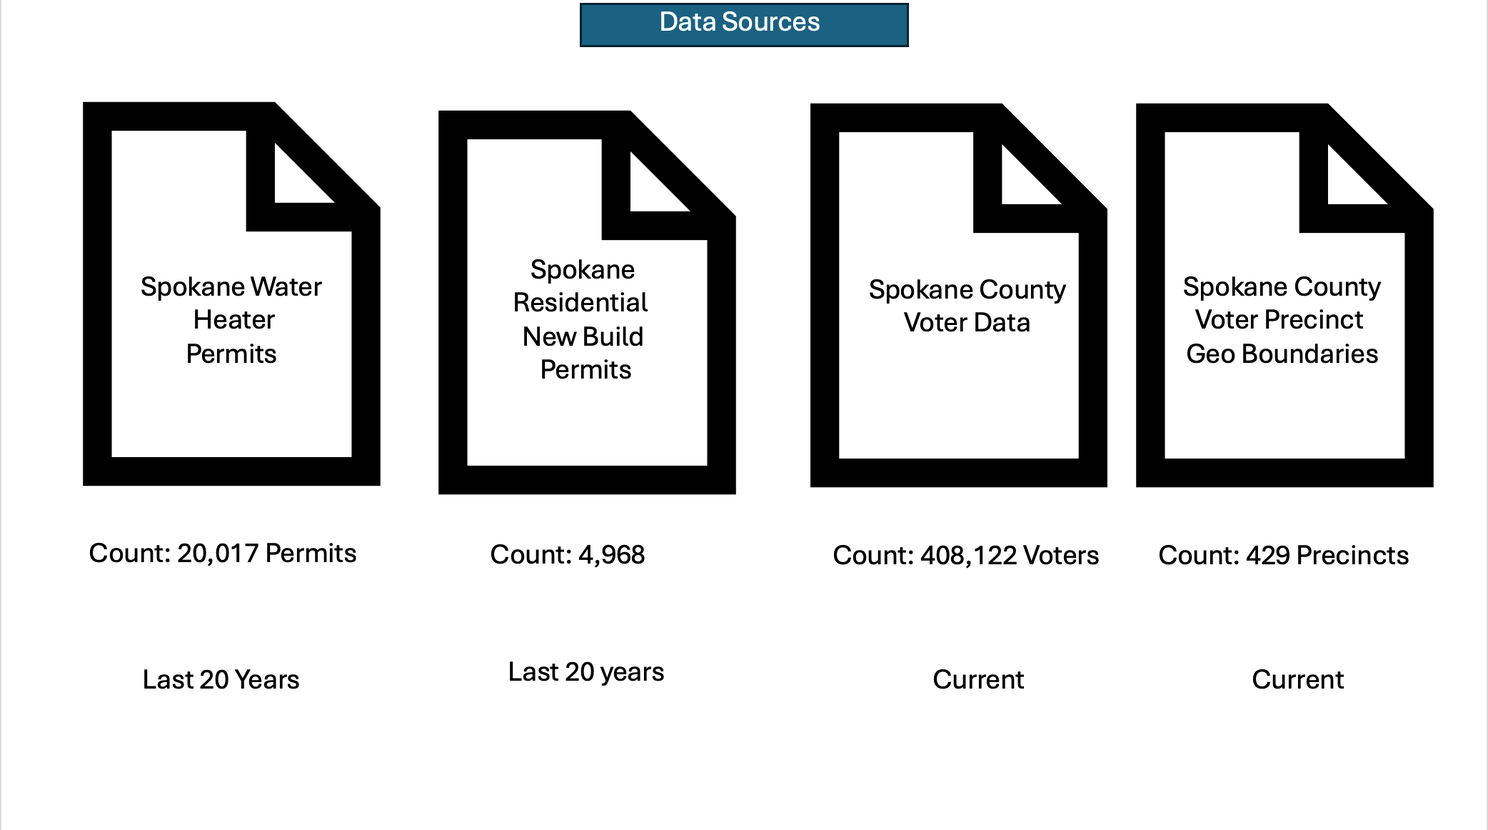
Data Gathering:
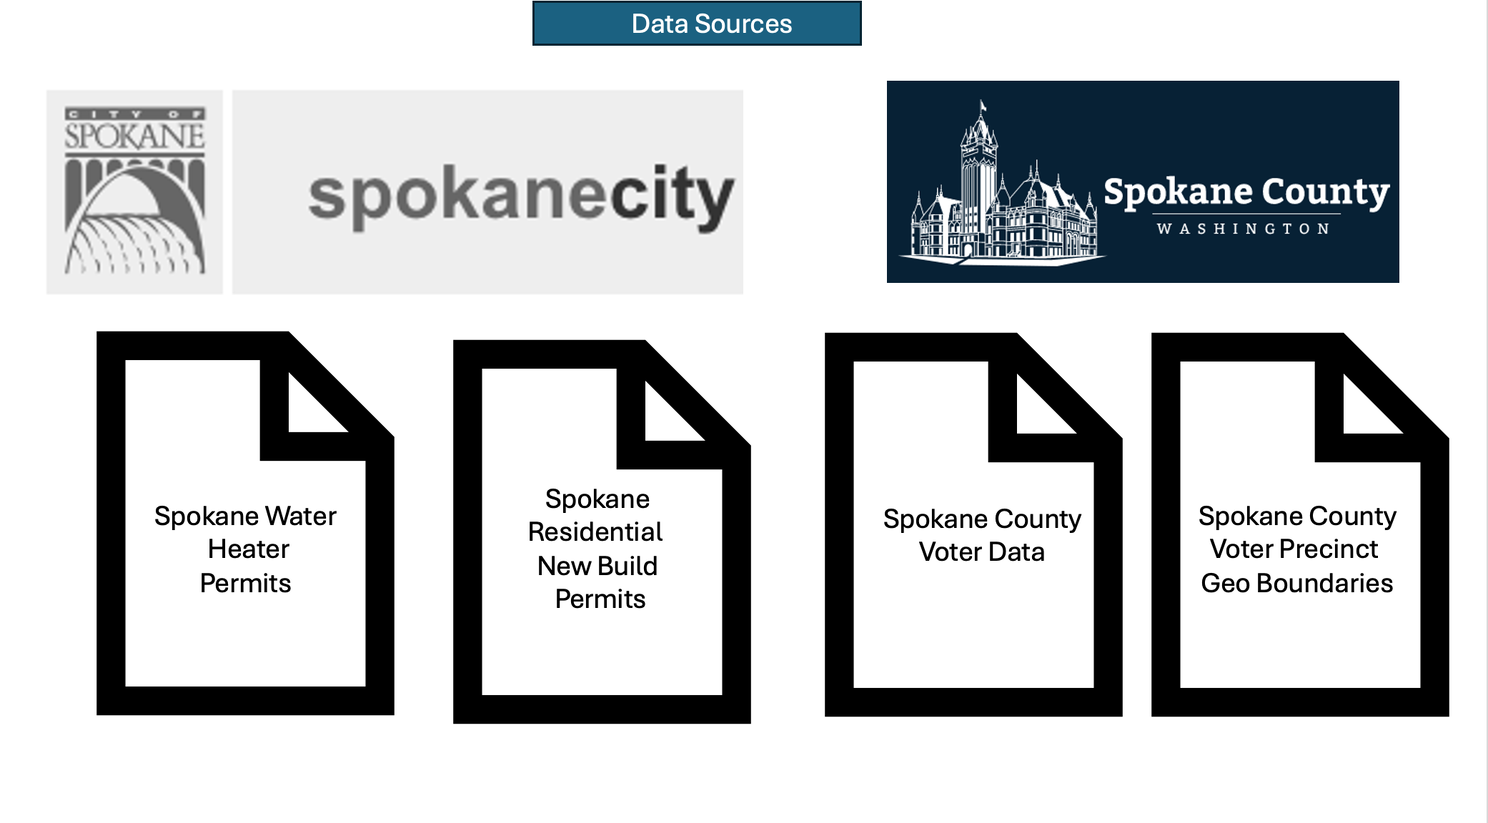
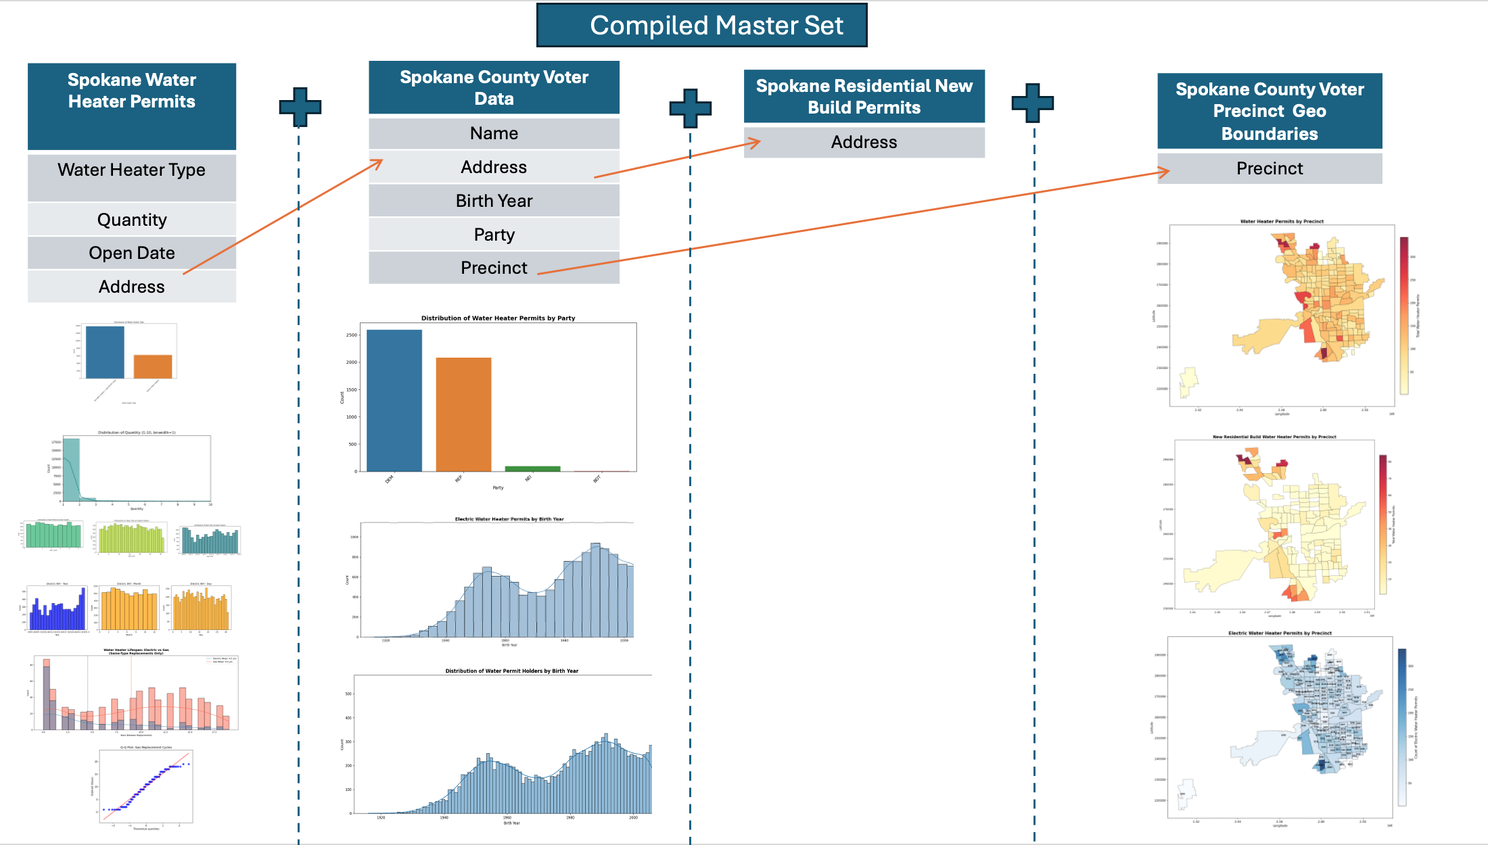
Data was gathered from two separate sources: The City of Spokane and Spokane County; The city possesses the permit data while the county controls the voter data and the digital geographical boundary shapefiles. Below is an image of the data combination with the germane variables. There are a total of four datasets labeled with column names and orange arrows on which the datasets are concatenated. Below the datasets are the visualizations generated from the individual dataset or the result of the dataset combination. The water heater dataset lacks a “Name” column. Notice that the Spokane Water Heater Permits dataset is merged on matching ‘Address’ with the Spokane County Voter Dataset; The voter dataset has the key variable ‘Precinct’ which is needed to match with the Spokane County Voter Precinct Geo Boundaries. At the same time, the Spokane Residential New Build Permits dataset was appended to isolate high frequency spikes in water heater permits per the precincts; Highlighting non-newbuild precincts with a high water heater permit rate. Voting precincts were chosen over other precinct types due quantity, more quantity allows more granular inspection of subdivisions.
Data Analytics Tools and Techniques:
A KDE plot was used to visualize the distribution and Shapiro-Wilk was used to test for normality. Kruskal – Wallace is germane to studying this data because it can compare distributions of data of non-parametric data. However, the Kruskal-Wallis test does not assume normality in the data (Statology, 2019). Overall, this is an exploratory quantitative data analytic technique and a descriptive statistic. The tools used will be Jupyter Notebook operating in Python code, running statsmodel api as a reliable open-source statistical library. Due to the data size, a Pandas data frame will be called, same with Numpy and Seaborn will be used for visualizations. A Kruskal-Wallis test will be the statistical test used with statsmodel’s Kruskal function. There will be a presentation Layer of Univariate and by Bivariate graphs. A QQ plot of residuals will be used to examine the results of the Mann-Whitney test. The Mann–Whitney U-test is ubiquitous in statistical practice for the comparison of measures of location for two samples where the assumption of normality is questionable (Grove, 1999).
Justification of Tools / Techniques:
Python will be used for this analysis because of Numpy and Pandas packages that can manipulate large datasets (IBM, 2021). The tools and techniques are common industry practice and have consensus of trust. The technique is justified through the integer variables necessary to plot against a timeline. In so doing, may just reveal different modes of frequency distribution. Another reason why the Kruskal-Wallis test is ideal is because the data is notoriously non-parametric in the wild. Because of the size of the dataset, Pandas and NumPy will be called. Python is being selected over SAS because the Python has better visualizations (Panday, 2022).
Project Outcomes: In order to find statistically significant differences, the proposed end state is a Kruskal – Wallis descriptive statistical model that can compare the distribution shapes of the targeted groups (Statology,2019). A visualization of the frequency distribution against a timeline. A cleaned dataset of all the correctly labeled columns and rows, for replication. A better understanding of previously stated groups with exploratory graphs, giving support as to what time engagement maybe highest. Lastly, a copy of the Jupyter NoteBook with the Python code will be available, along with a video presentation added by PowerPoint. According to the same study Kruskal-Wallis was instrumental in support for alternative hypothesis, against other categorical variables. (Kusakana, 2022).
The python code for replication can be found here:
The Findings:
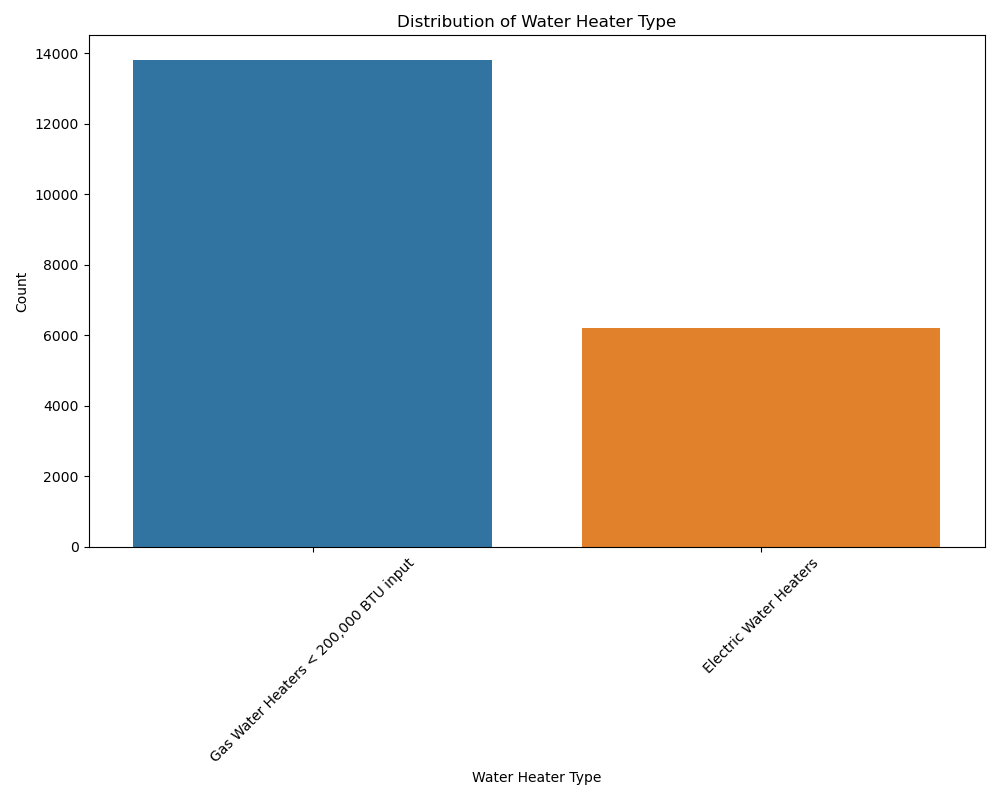
The below graph shows gas vs. electric water heater counts. Notice that gas is more than double that of electric.
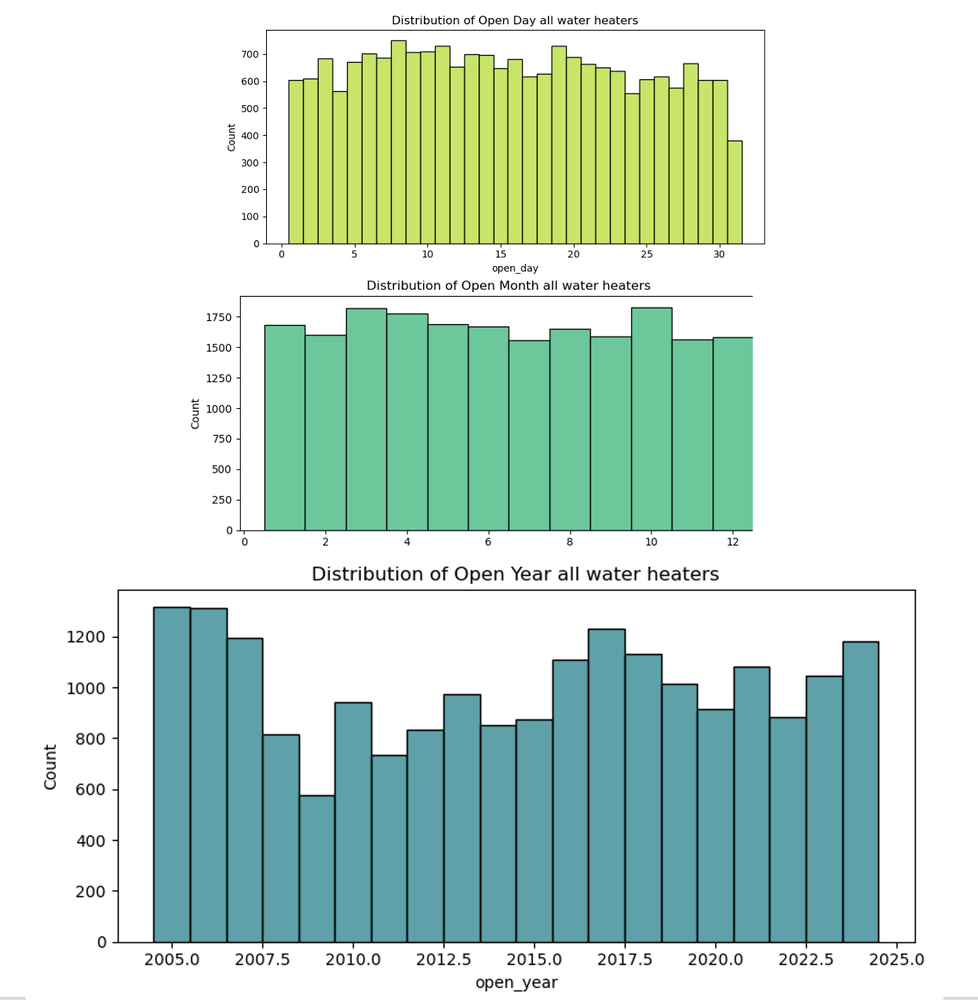
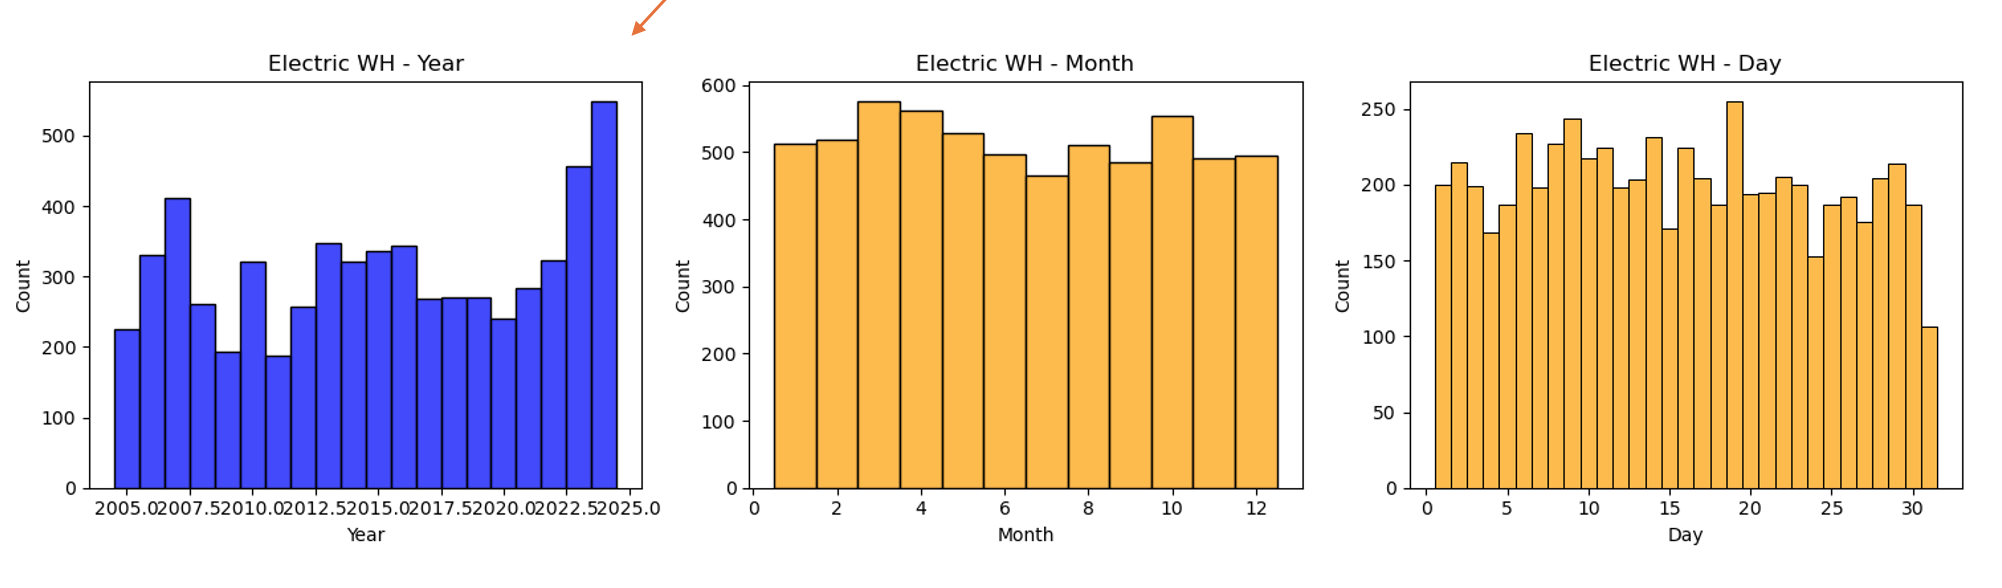
In the following graphs, the ‘open date’ column was parsed into unique variables of ‘day’, ‘month’, and ‘year’; Explored with all water heaters and electric water heaters. The distributions appear to be continuous. The only distinct spike is the blue graph, of electric water heaters permits in 2024. The city of Spokane has an average of approx. 850 water heater permits filed per year. Furthermore, according to the city of Spokane permit fee schedule, it’s a flat $15 for a water heater permit (2026); Meaning that the city generates 850 x $15 = $12,750 in Water Heater Permit fees.
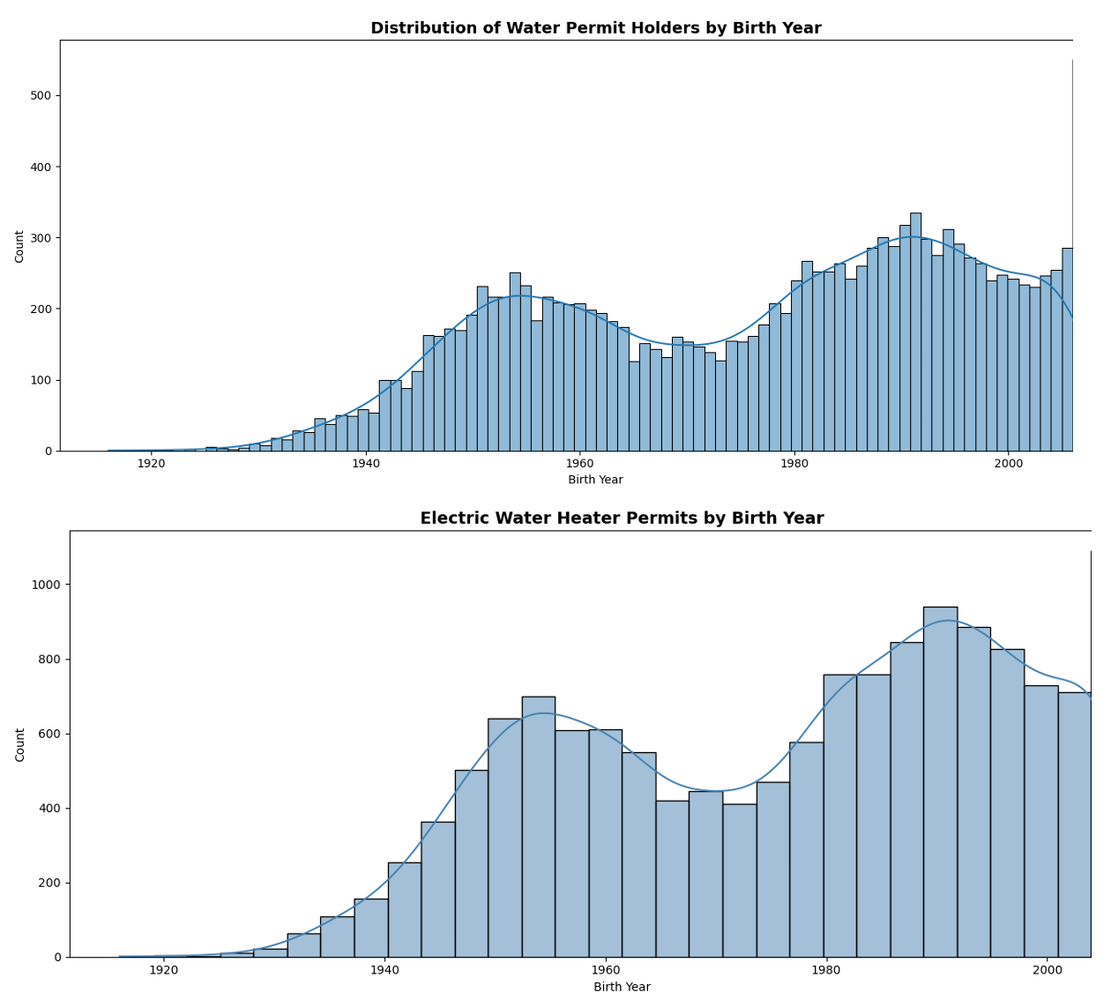
The below graphs show the distributions of ‘Birth year’ for voters associated with water heater permits. Notice that the highest frequency spike is a approx. 1990. Meaning, the most common age that someone files for a permit is 36 years old. Additionally, the distribution is multi-modal, as in there are to distinct frequency mounds: in 1990 and 1950; Creating a saddle in between. Directly below that stated graph is the age distribution of electric water heater permits. Notice that the distributions appear to be the same, indicating that gas vs. electric preference is not filer age dependent; In other words, there is no generational purchase preference of any one type of water heater.
The following graph is created by sorting the instances in the data set by address and ‘open year’ and looking for instances with exactly two water heater permits per address. Looking for three or more permits at the same address would allow apartment locations to skew the sample. Therefore, the only replacement data graphed and analyzed is of residential addresses. An additional variable separating ‘pair_types’ after grouping by ‘Address’ and ‘Water Heater Type’ give us the type-pair combinations:
Gas Water Heaters -> Gas Water Heaters = 757
Electric Water Heaters -> Gas Water Heaters = 344
Electric Water Heaters -> Electric Water Heaters = 261
Gas Water Heaters -> Electric Water Heaters = 0
757 gas-to-gas replacements vs 261 electric-to-electric — gas dominates same-type replacements, consistent with it being 2x more common in the dataset. 344 type-switchers is surprisingly high — meaning roughly 25% of people with an electric heater, switch to gas.
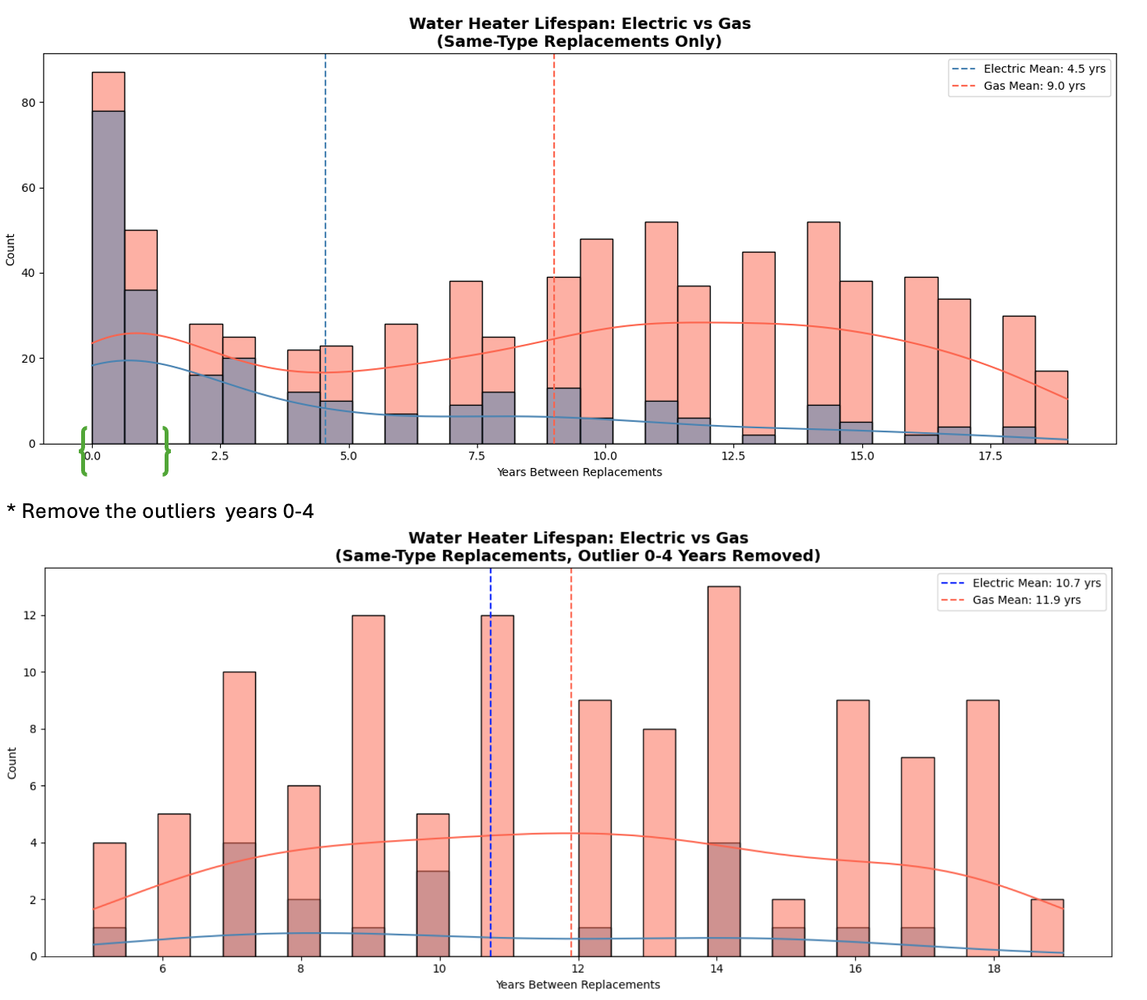
The below graph shows Water Heater Lifespan of Gas vs. Electric with Same-Type Replacements only. Glaringly, the outliers of 0–1-year replacement window is the highest frequency for both gas and electric. According to Nokia Bell Labs, that spike is known in the industry as “Infant Mortality” for electronic equipment (Holcomb & North,1985). AKA: “Bathtub Failure distribution”, “Bathtub distribution”, or “Bathtub Curve Failure Model” (Heiser, 2019).
Past the infant deaths 0-1 year, the distribution of gas water heaters replacement cycles appears “bell-shaped”, parametric, or Gaussian. The bell takes a more distinct shape starting at the 5-year mark; Therefore, the outlier years from 0-4 were removed to make the second graph. While the red trendline for the gas is bell-shaped, the blue trend line for electric, appears to trend down to the right.
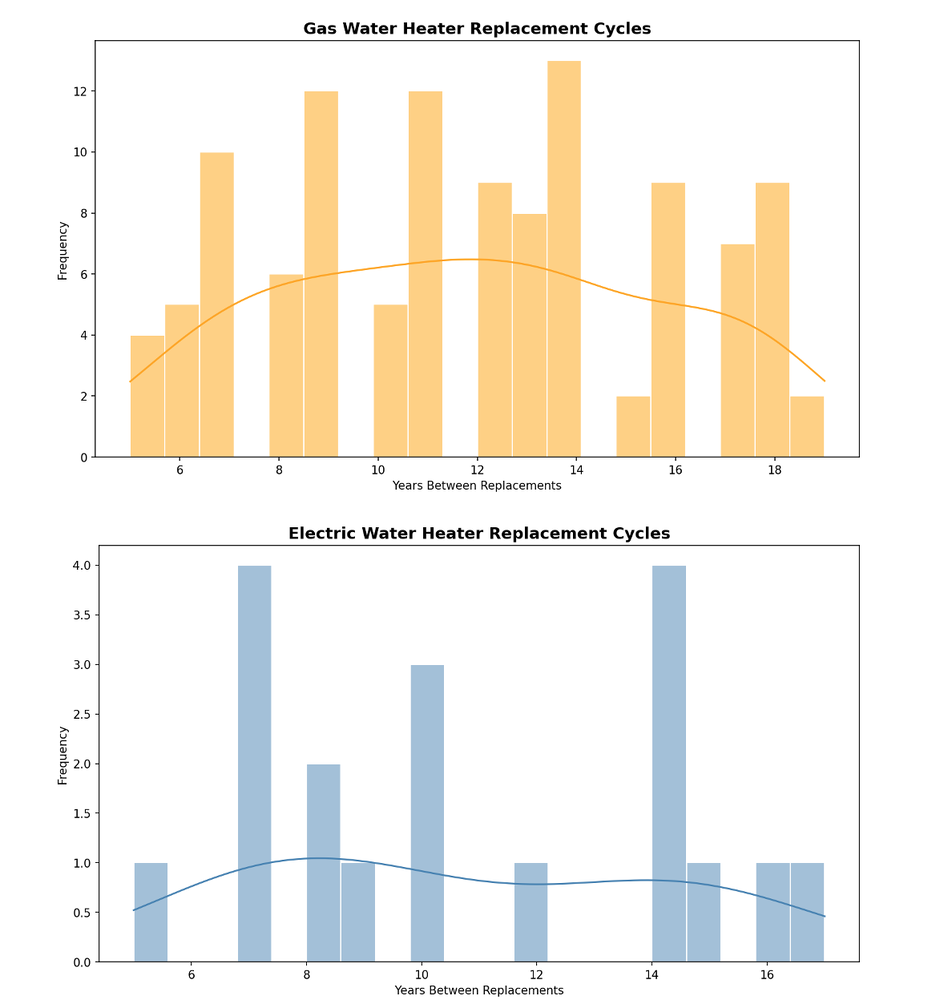
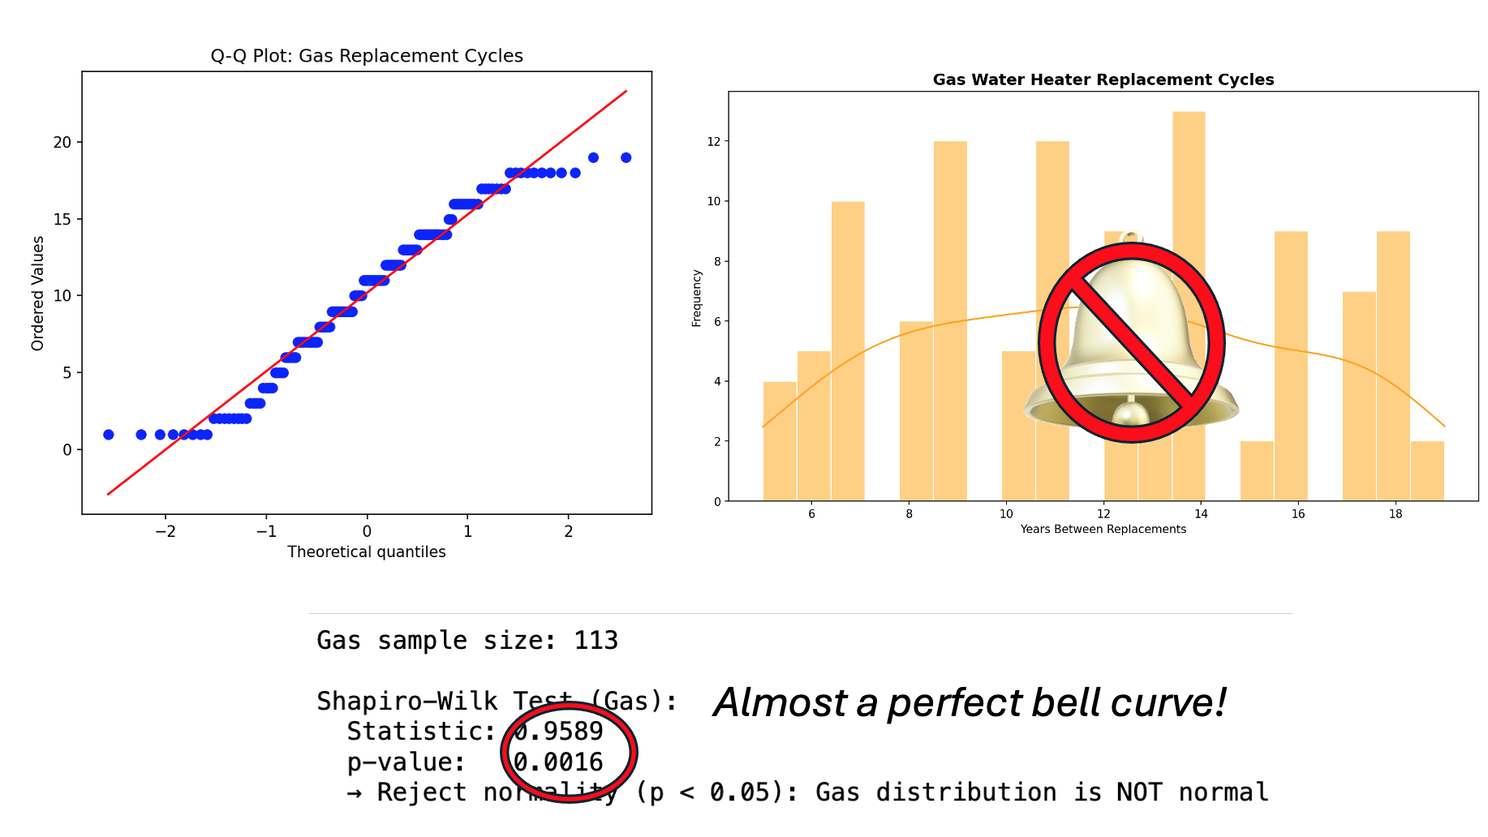
Both distributions of gas and electric have been isolated for statistical testing in the below graphs; With the gas distribution in yellow and Electric in blue. Notice how the gas distribution trendline appears to be bell-shaped while the electric trendline appears to be multi-modal; With random looking frequency spikes, pronounced on the 6,10, and 14-year marks.
Kruskal Wallis is used to compare two or more distributions, with no assumption of normality in the data.
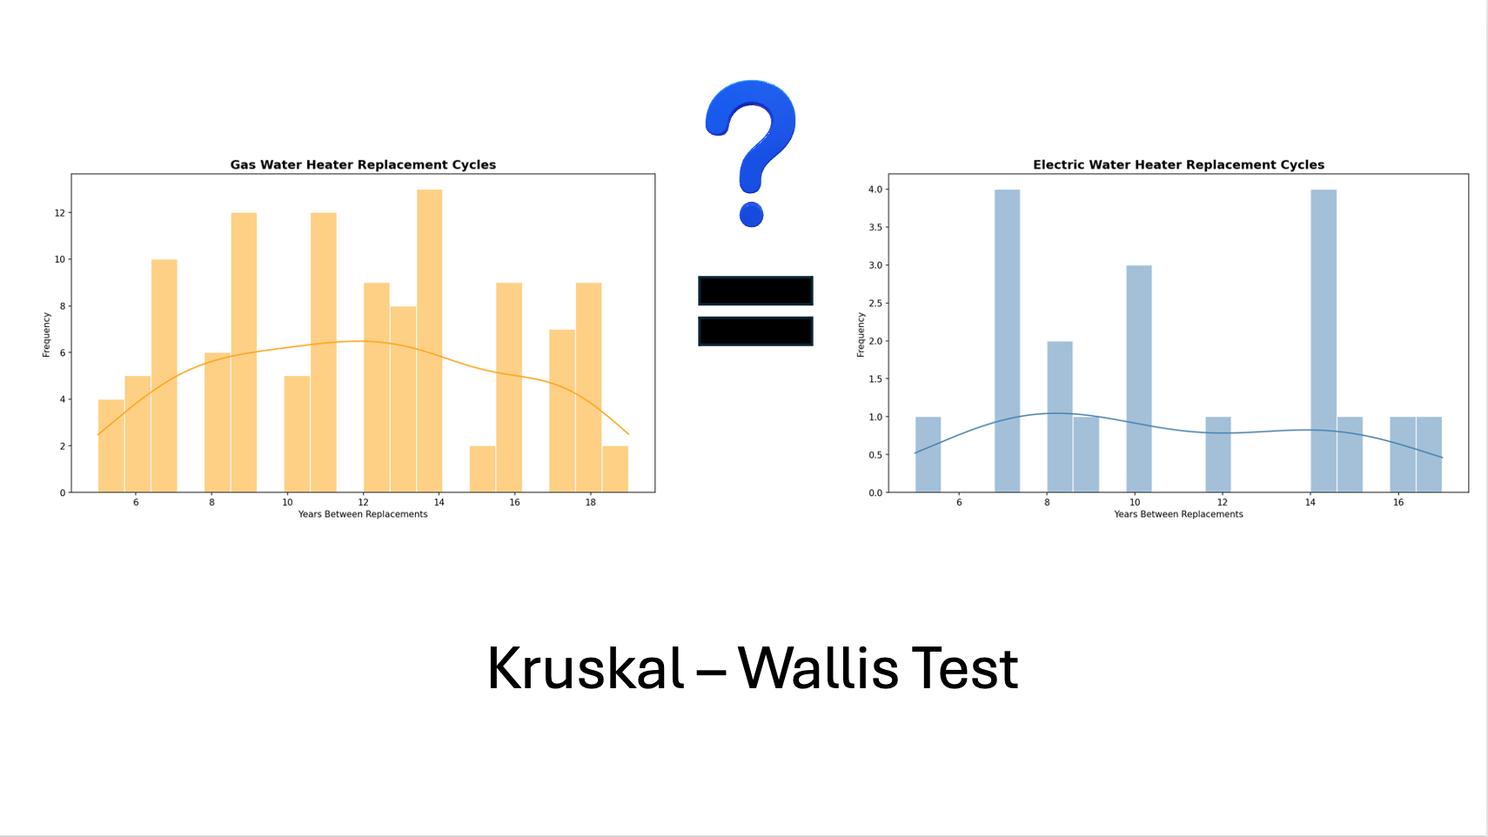
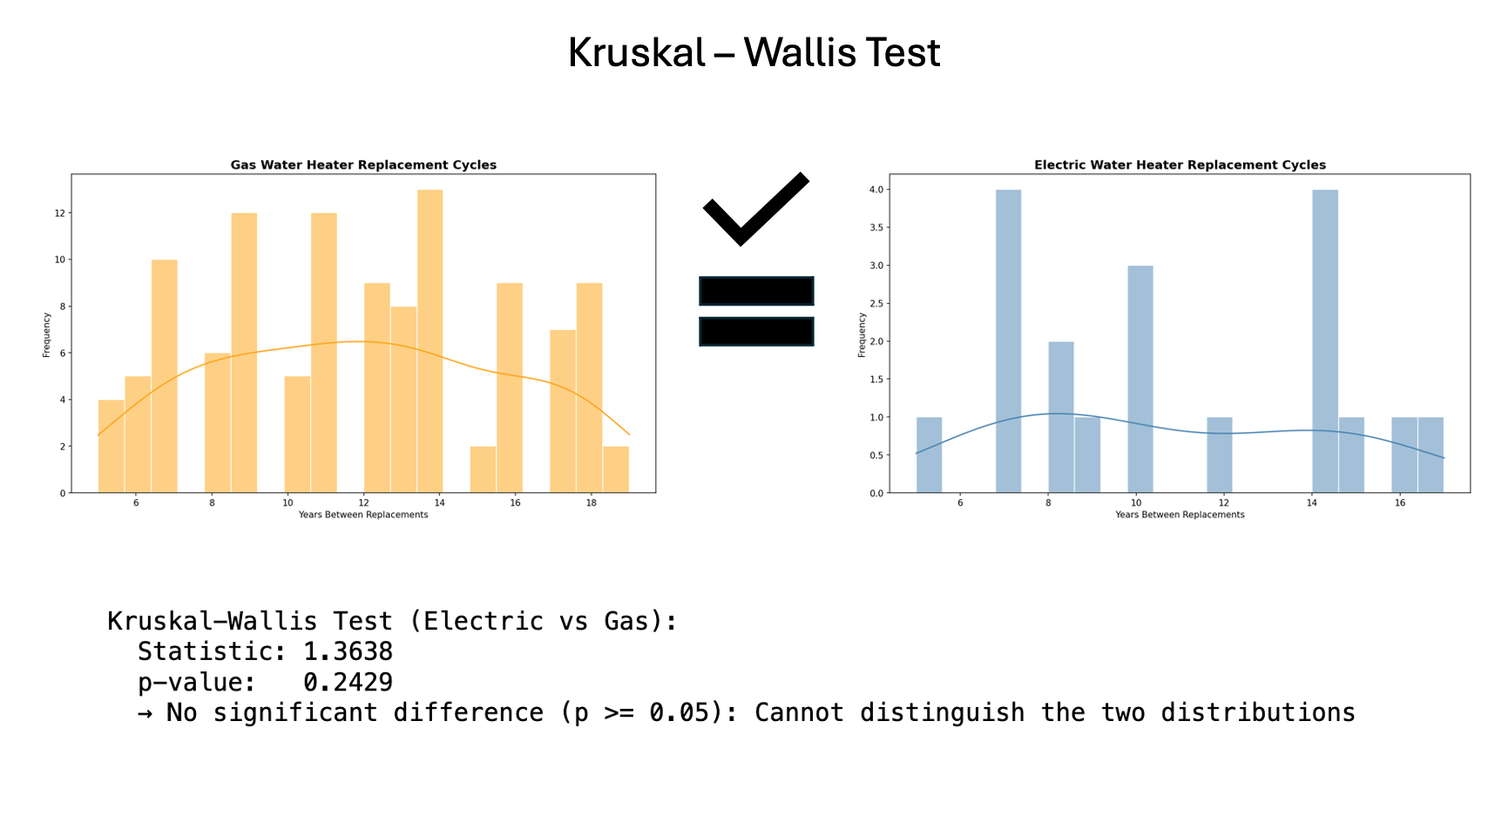
The above results of the Kruskal Wallis test indicate that the distributions are the same with a p-value of 0.24. While to the human eye, both graphs appear to be different, they are statistically the same. However, if more aggregate instances were gathered of electric water heater permits from other cities, then the electric water heater distribution may take on a more bell-shape.
The Mann-Whitney U Test is used as a confirmation. The Mann-Whitney U test compares two non-parametric distributions. The test resulted in same p-value of 0.24 confirming that both distrobutions are the same and accepting the null hypothesis.
The following graphs are the results of the Shapiro-Wilk test, after testing the gas water heater distribution (with outliers removed) for normality. The result scored a statistic of .958; Meaning that it is almost a bell curve, it just a “dented bell”, as can be noticed visually with the autogenerated trendline. Furthermore, the QQ plot indicates the residual’s goodness of fit in relation to the trendline going to up to the right; The QQ plot shows the residuals have tight hemostasis about the mean, except the tails, and conforming the generated statistic score. However, we must reject the null hypothesis of Shapiro -Wilk; At the same time, some water heater manufacture statisticians could argue that it’s a “sampling error” and their product falls on a perfect bell-curve. Either way, the analysis demonstrates honest attempt at lean six sigma quality of modern water heater manufacturing. While more water heater data collected from other cities might just “un-dent” the bell, reveling a more perfect bell – curve. If that is the case, what would be the threshold between the amount of data collected and percentage perfect the bell could be?
Importantly, given the almost-bell shaped curve, it indicated that’s that addresses can be marginally predictive as to when the water-heater will go out.
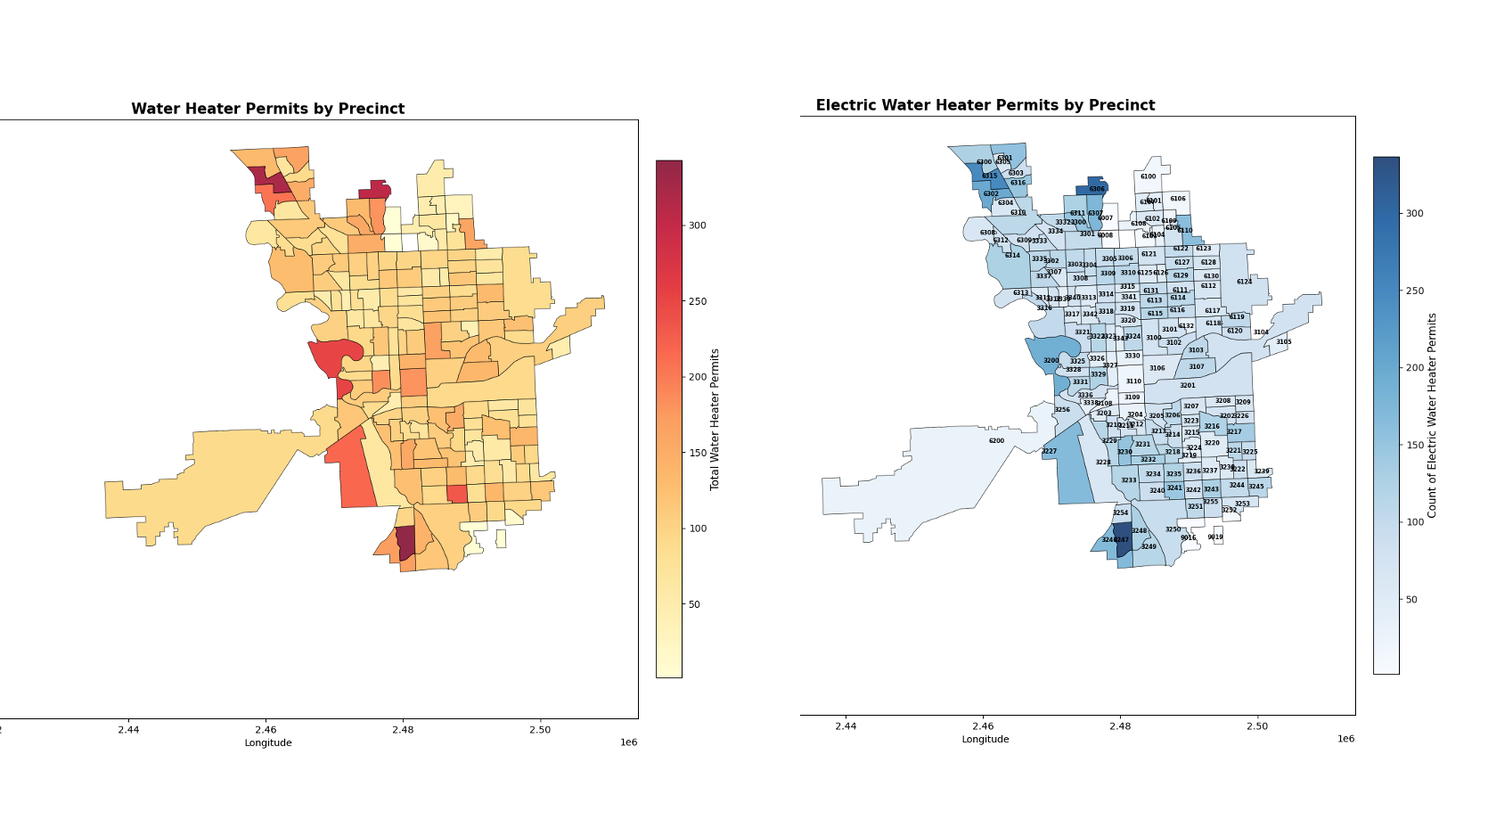
The next graphs are rendered from concatenating the Spokane County Voter Precinct shape-file to all water heater permits (cumulative left) and the electric only on the right. Notice the graphs are heat maps where the darker color represents the frequency of water heater permits per voter precinct.
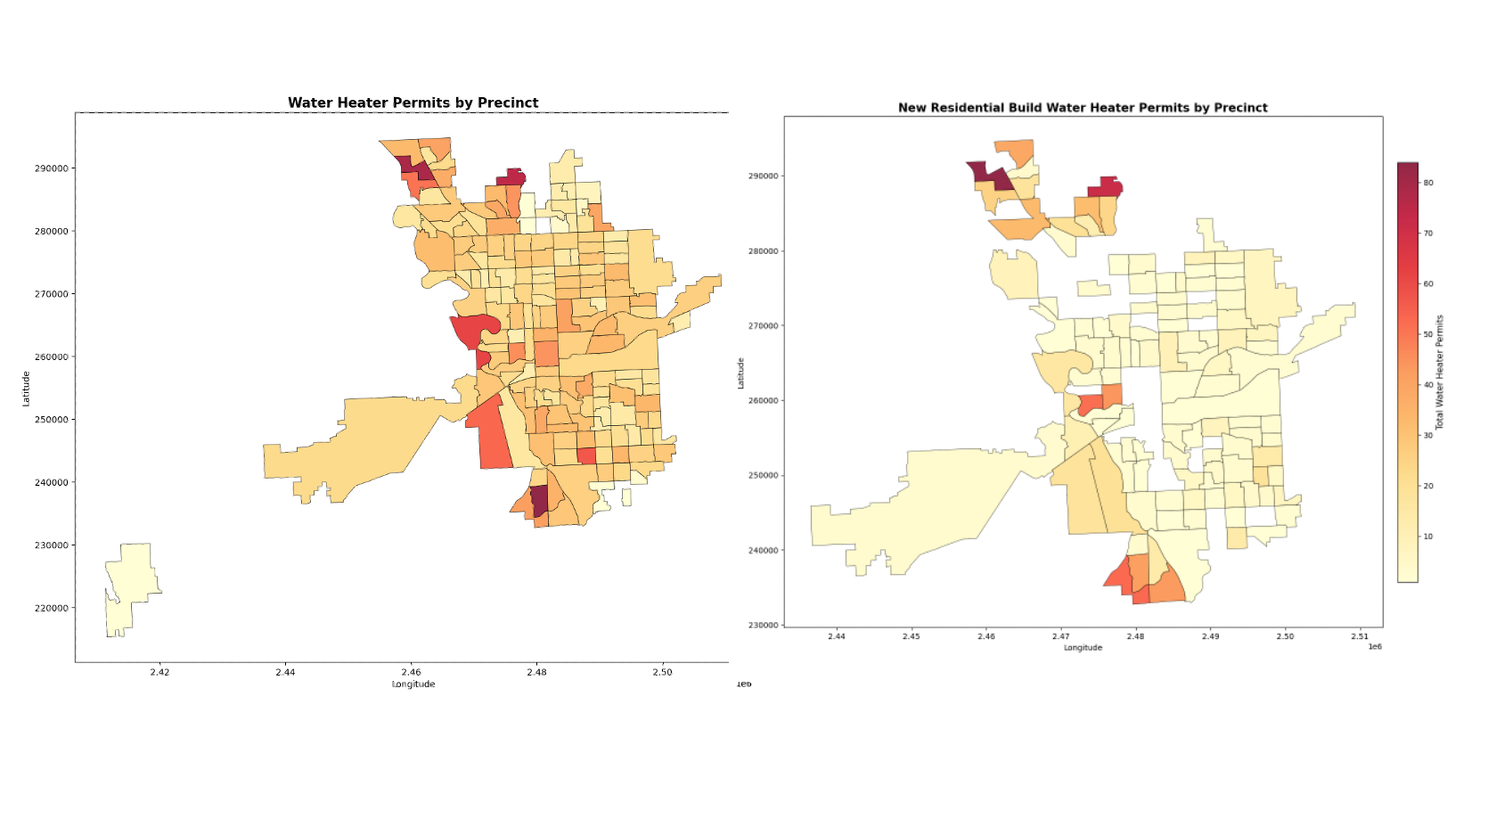
While the above graphs tell a visual story, they don’t isolate the precincts that are “new-builds”. That’s why the Spokane New Build Permits dataset was appended to all the water heater permits (regardless of category) and visualized below.
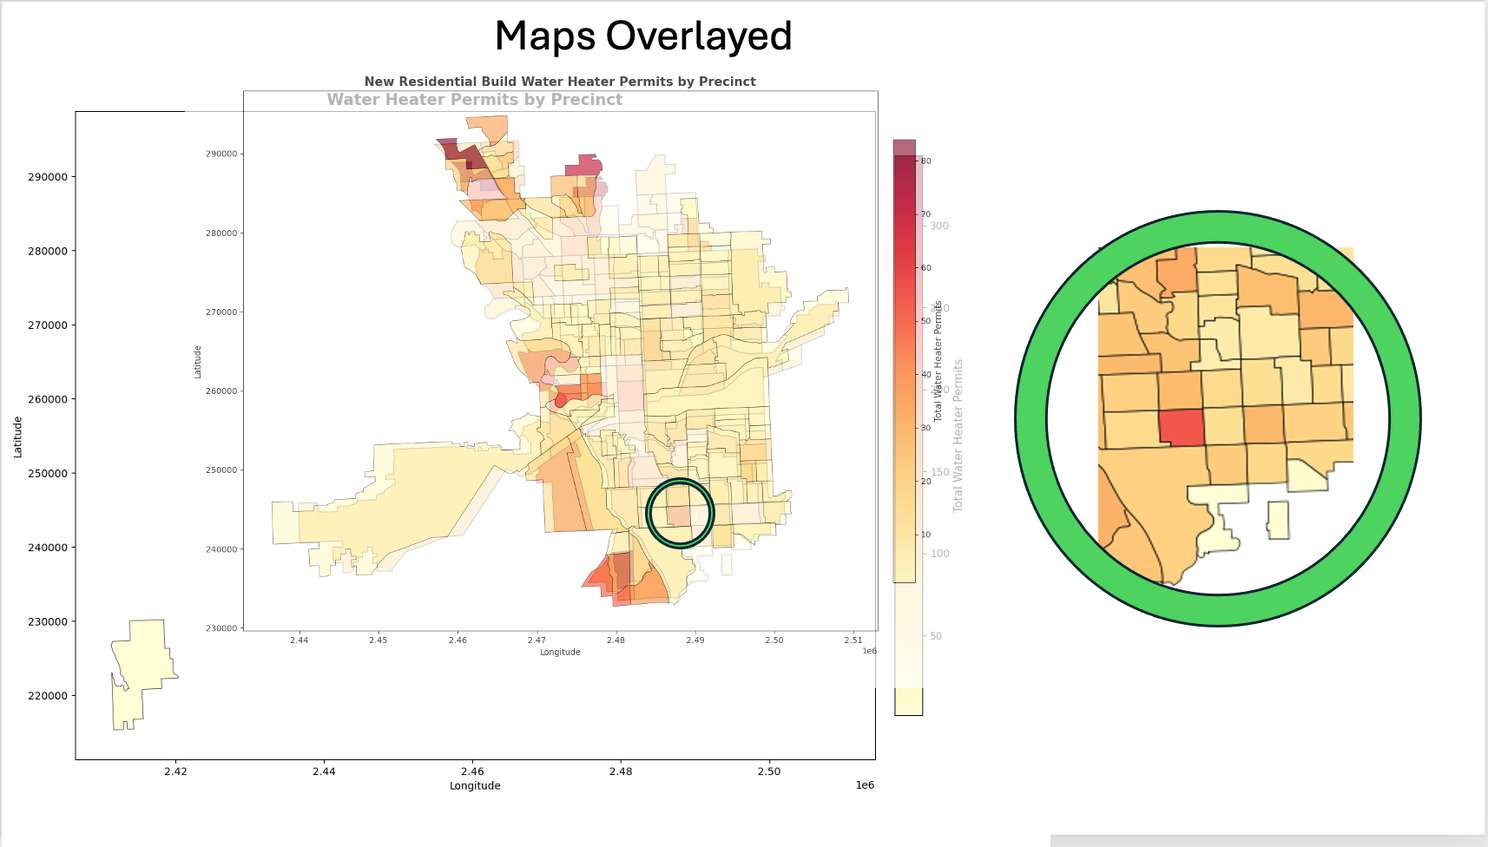
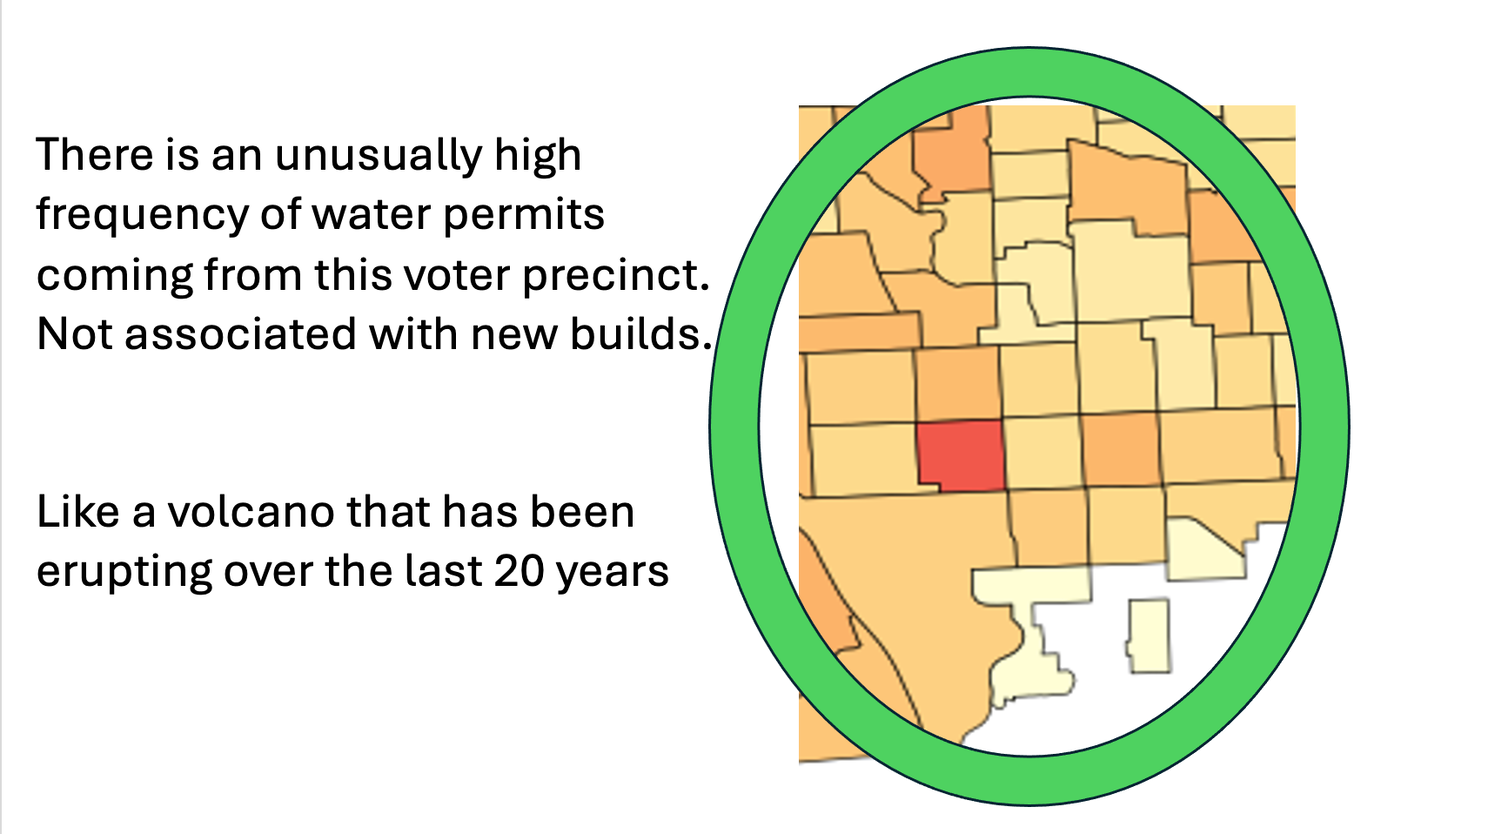
On the left is the same graph as the above left, all water heaters permits per precinct; While the map on the left shows all the water heater permits per precinct, reduced to the only the instances of new build permits. After overlapping the maps, it highlights precincts that have a high frequency of water-heater permits that are not new-build areas; Indicating that these lot(s) of water heaters, in a particular subdivision, are beginning to wear out. That map overly is a Spokane Water Heater Aging Infrastructure Map.
In final analysis:
1. Is there a statistical difference in the lifespans of Gas vs. Electric water heaters?
No, we accept the null hypothesis of both Kruskal – Wallis and Mann – Whitney U test: Both shapes are statistically possible to be equal.
2. What is the rate that people switch between water heater types?
Gas Water Heaters -> Gas Water Heaters = 757
Electric Water Heaters -> Gas Water Heaters = 344
Electric Water Heaters -> Electric Water Heaters = 261
Gas Water Heaters -> Electric Water Heaters = 0
Approx. 25% switch water heater types from electric to gas at the same residence.
3. What water heater type is the most common?
Gas
4. What is the most common age of a person that applies for a water heater permit?
36
5. Does water heater type depend on the permit filer’s age?
No, both age distributions appear to be equal regardless of water heater type.
6. How much annual revenue does the City of Spokane make in selling water heater permits?
Approx. $12,750 annually in water heater permits.
7. Does the distribution of water heater life cycles fall on a bell-curve?
At 0.958 its close but no, the results of the Shapiro – Wilk suggest we reject the null hypothesis: The distribution of Spokane water heater life cycles is not parametric.
8. What current Spokane subdivision(s) are currently experiencing a high amount of water heater permits filed?
Most locations of high permit filing come from the residential new build locations.
9. How many of those high frequency locations are not associated with residential new-build activity?
See the above map.
10. Can we create and Aging Infrastructure Map for water heater replacement prediction waves and demand response targeting for the City of Spokane?
See the above Spokane Water Heater Aging Infrastructure Map overlay.
Work Cited:
Heiser, T., & Hofmeister, J. P. (n.d.). Bathtub, failure distribution, MTBF, MTTF, and more: They are related. Ridgetop Group, Inc. Retrieved January 18, 2023, from https://www.ridgetopgroup.com/rgi_content/uploads/2025_/publications/Bathtub,%20Failure%20Distribution,%20MTBF,%20MTTF,%20and%20More%20They%20are%20Related.pdf
IBM. (n.d.). Python vs. R: What’s the difference? IBM Cloud Blog. Retrieved January 18, 2023, from https://www.ibm.com/cloud/blog/python-vs-r
Item, B., Chowdhury, B. H., & Bhattacharya, S. (2020). Forecasting the power consumption of a single domestic electric water heater for a direct load control program. IEEE Xplore. https://doi.org/10.1109/9275646
Nehrir, M. H., Wang, C., & Shaw, S. R. (2014). Electric water heater modeling and control strategies for demand response. IEEE Transactions on Smart Grid. https://doi.org/10.1109/6770821
Pandey, Y. (n.d.). SAS vs Python. LinkedIn. Retrieved January 18, 2023, from https://www.linkedin.com/pulse/sas-vs-python-yuvaraj-pandey/
Rousseau, P. G., & van Eldik, M. (2022). Using statistical tests to compare the coefficient of performance of air source heat pump water heaters. Journal of Energy in Southern Africa, 33(1). https://doi.org/10.17159/2413-3051/2022/v33i1a10816
SciPy. (n.d.). scipy.stats.kruskal — SciPy v1.10.0 manual. Retrieved January 18, 2023, from https://docs.scipy.org/doc/scipy/reference/generated/scipy.stats.kruskal.html
City of Spokane. (n.d.). Public records. Office of Administrative Services. Retrieved January 18, 2023, from https://my.spokanecity.org/administrative/public-records/
City of Spokane. (2025). Final development fee schedule 2025. Spokane Permits. Retrieved from https://aca.spokanepermits.org/CitizenAccess/Documents/Final%20Development%20Fee%20Schedule%202025.pdf
Zach. (2022, March 7). Kruskal-Wallis test: Definition, formula, and example. Statology. Retrieved January 18, 2023, from https://www.statology.org/kruskal-wallis-test/
Yang, S., & Berdine, G. (2021). Normality tests. The Southwest Respiratory and Critical Care Chronicles, 9(37). https://doi.org/10.12746/swrccc.v9i37.805

Learn more about Data Mining Mike here:


Leave a comment